Interactive maps of U.S. hyperscale data-center corridors and the county-level labor-market, wage, and public-finance effects they create, with case studies from Loudoun, Henrico, Licking, Douglas, and Morrow.
Roughly 70% of the world's internet traffic is estimated to pass through Loudoun County, Virginia on its way between networks.[6] That single fact, not tax policy, not workforce availability, explains most of what you're about to see on these maps. Once the fiber is there the campuses follow; once the campuses are there more fiber follows; and the agglomeration becomes self-reinforcing until half the world's hyperscale capacity is clustered along a few dozen miles of the I-95 corridor.
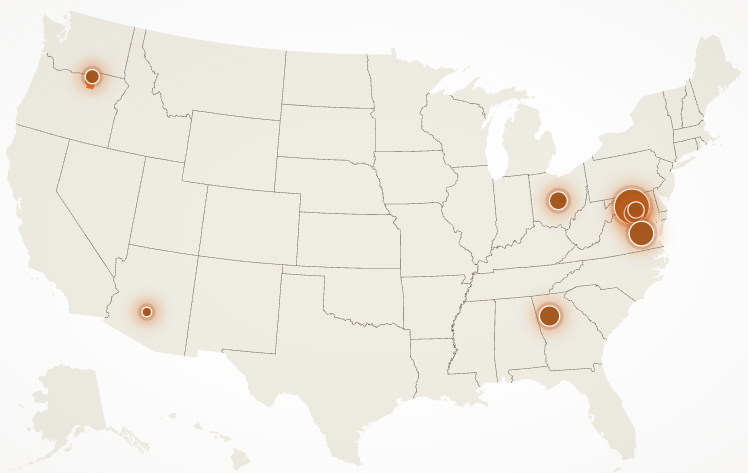
The rest of the U.S. data-center industry is concentrated in a similarly small set of power- and fiber-rich geographies: the Richmond/Sandston area south of Washington, central Ohio around New Albany, the Atlanta west-suburban corridor, the Phoenix metro, and eastern Oregon along the Columbia River. The labor-market story these campuses tell, though, is not the one the press releases imply. Construction demand is enormous but temporary; permanent operations workforces are smaller and more specialized than a local official would guess; and the biggest spillover in most host counties is fiscal, tax revenue that reshapes what a county can afford to build.[1]
Below: a map of where the industry actually is, paired with county labor data that lets you see whether the broad "jobs" claim holds up.
 RadiusMapper
Each circle is a campus or cluster; area scales with megawatts where published. Click any point for operator, capacity, and status. Three circles carry the argument: Loudoun, Richmond, New Albany. Between them they represent more than half of U.S. hyperscale activity and almost all of its recent acceleration.[1]
Start with Virginia because it's where the industry publishes the most. The state's Joint Legislative Audit and Review Commission, a non-partisan oversight body, found that about 80% of Virginia's data-center industry sits inside Loudoun, Prince William, and Fairfax, and Loudoun alone accounts for roughly half of the state market by sites, square footage, and estimated energy use.[1] Outside Northern Virginia the review identifies newer growth near Richmond and Mecklenburg and expects significant expansion along the I-95 corridor. Operator pages show the same pattern in central Ohio, Atlanta, Phoenix, and eastern Oregon. The reason Virginia matters for this article is simple: it publishes employment, wage, and fiscal disclosures that other states haven't matched, so what we can prove nationally tends to start with what's been measured there.
Two of those numbers belong together. A single large Virginia campus can have about 1,500 workers on-site at peak buildout against only about 50 permanent direct operating jobs once it's running.[1] That 30-to-1 ratio is the single most important number in this article: every other finding follows from it. When a site announcement promises "jobs," the jobs are mostly construction, and they disappear on the schedule the contractor sets. The right comparison for a data-center campus is not an office tower or a software campus; it's industrial infrastructure, closer in labor profile to a gas turbine plant or a paper mill than to a tech employer.
The corridors don't all tell the same story. Each one is pinned down by a different binding constraint, and each one is an example of a different phase in the U.S. industry's maturation.
Abstract talk about fiber density and peering becomes concrete when you see it. From above, the Northern Virginia cluster is a ring of warehouse-scale campuses wrapped around Dulles, each within a few miles of an existing transmission spur and each backed by the same handful of fiber routes that serve the Ashburn peering economy. This is the land that makes site selectors' shortlists before any tax package is negotiated — and once you see it, every other corridor on the map starts to make sense as an attempt to reproduce parts of what Ashburn already has.[1]
RadiusMapperSame industry, entirely different geography. Eastern Oregon's campuses sit against open farmland along the Columbia River, which supplies both hydro power and cooling water at a fraction of the cost of Northern Virginia's grid. There's no Ashburn-style fiber ecosystem here; what AWS has built instead is a rural power play anchored to a single river and sustained by one operator for more than a decade. The labor arithmetic is where this story gets interesting, because AWS publishes 8,320 FTE jobs supported by this cluster against an underlying Morrow County civilian labor force of only around 6,900 — a disparity the article returns to below when we parse what "supported" actually means.[5]
RadiusMapper“— Virginia JLARC, 2024A single large campus can have about 1,500 workers on-site at peak buildout, against roughly 50 permanent direct operating jobs once it's running.
”
The cleanest way to read the labor-market effect is to look at the counties hosting the largest campuses and compare 2015 to 2025. Covered employment, average weekly wages, and unemployment all moved in the "right" direction, but the mix of that movement varies a lot by county, and none of it proves data centers alone drove the change.[2]
Unemployment fell in every case county between 2015 and 2025, with the largest drop in Douglas (−2.2 points). That's consistent with the broader national tightening of the labor market and does not isolate a data-center effect, but it rules out the simplest counter-story — that data-center-heavy counties are somehow worse off in headline labor terms.[2]
Across these five case counties, covered employment rose between roughly 6% in Henrico and 47% in Licking, while average weekly wages rose between 27% and 53%. Counties attracting large campuses have generally been places with strong job and wage growth and low or falling unemployment, but they are also counties sitting inside broader metro growth engines, so data-center causation should not be over-read.[2][3]
The aggregated growth numbers above hide what each county actually did with its data-center windfall — where the revenue went, what the community got, how the story is being told locally. The panels below pair each county's 2015 → 2025 employment and wage move with the specific community fact that anchors its narrative:
The strongest consistent effect is construction, and it's front-loaded: a ~1,500-worker peak during buildout against roughly 50 permanent direct operating jobs once a large campus is running.[1] The capex-to-headcount ratio helps explain why that number is so small: a typical hyperscale campus of ≈$1–2 billion in capital spend per ~50 permanent direct jobs works out to $20–40 million of capex per permanent job, an order of magnitude higher than office or logistics developments that absorb comparable land area.[1] The AI buildout has sharpened this further. Traditional cloud racks draw ~4–10 kW each; dense GPU racks for large-model training now pull ~40–120 kW, roughly a 10× density shift that forces new cooling, power-distribution, and construction labor requirements without proportionally expanding permanent headcount.[11]
The second effect is specialized but narrower long-run ops hiring, electrical, mechanical, controls, critical-environment, network, and security roles that are real and often well-paid, but modest relative to the capital going in. A subtlety that explains which trades benefit: hyperscale campuses don't connect to neighborhood distribution (12–35 kV) — they connect directly to transmission (typically 230 kV or 500 kV), through dedicated substations that take 18–36 months to permit and build.[11] So the labor that follows a campus isn't local linemen; it's substation crews, transmission engineers, and HV switchgear manufacturers. National working-paper evidence adds a sharper point still: the average county-level earnings and employment effect is concentrated in metro host counties, and close to negligible in non-metro host counties.[3] The agglomeration a county brings into the deal matters more than the campus itself.
The third effect, and the one residents often notice first, is public finance, and here the asymmetry is dramatic. Data centers in Loudoun occupy roughly 4% of the county's commercial parcels but generate about 38% of general-fund revenue.[6] In the wider JLARC mature-markets set, data-center revenue ranges from under 1% to 31% of local tax revenue; Henrico explicitly tied new data-center revenue to a $60M affordable-housing trust fund, with 34 homes sold and 349 more approved as of early 2026.[1][4] So the story isn't only fiscal extraction; where local institutions choose to, they can recycle the tax windfall back into public services that the population actually sees.
Some of the most quoted "economic impact" numbers in this space come from sponsor-published studies, AWS's eastern Oregon community-impact materials, for example, which report 8,320 FTE jobs annually and $54.2 million in 2024 property taxes and fees, and which fund local college and scholarship programs.[5] These numbers are real but the framing hides the arithmetic: Morrow County's total civilian labor force in 2025 is only about 6,900, and neighbor Umatilla's is roughly 32,000.[2] 8,320 "jobs" cannot plausibly sit inside that labor shed as direct employment. The figure is inclusive — direct + indirect + induced across the broader I-84 corridor — and is useful as a spillover estimate but not as a headcount. Sponsor numbers are valuable context, but they're sponsor-produced estimates, not neutral public accounts. Treat them as operator-sourced and label them as such.
Most of the article so far is U.S. data because the U.S. publishes the cleanest labor statistics. The international picture fills in a few edges of the argument that U.S. data alone can't quite reach.
Together these say the same thing in different national accents. Permanent direct employment is small per megawatt; the bigger labor consequences are construction, power-system trades, and the planning bureaucracy around siting.
AI will almost certainly increase data-center demand, but automation and capital intensity mean headcount per megawatt is not scaling proportionally. The labor bottlenecks ahead are not mostly software engineers; they are electricians, HVAC and controls technicians, substation and transmission workers, and critical-environment facility crews. BLS projects sustained electrician openings through the decade, and multiple state utility capital plans are being revised upward specifically because of data-center load growth.[11]
The corollary is a harder sell politically than "data centers bring jobs." The real AI-era job creation in host regions looks less like a white-collar hiring wave and more like pouring pads, commissioning chillers, running cable trays, building substations, and keeping facilities online, with domestic-manufacturing niches for switchgear, transformers, cooling systems, and backup power. The policy question is whether workforce-development pipelines are sized to meet that demand, not whether they are steering graduates into the "right" software jobs.
Both, depending on the market. In mature Virginia jurisdictions, data-center revenue has exceeded the cost of public services they consume by a wide margin — Loudoun collects roughly 38% of general-fund revenue from campuses that occupy about 4% of commercial parcels, and the county has used the windfall to lower real-estate tax rates.[6] But the cost side of the ledger shows up somewhere else: on the utility bill. Multiple state utility-commission filings cite data-center load growth as the specific reason transmission and generation capital plans are being revised upward, with those upgrade costs allocated across all ratepayers. Virginia's JLARC review has flagged this explicitly as a ratepayer-subsidy question worth watching even in counties that come out ahead on the tax ledger.[1][11]
Two directions at once. Loudoun and Prince William have seen land near major substations get rezoned and bid up; farmland near Sandston and New Albany has traded hands to operator intermediaries ahead of public announcements. On the other side, counties that choose to can recycle data-center revenue directly into housing supply. Henrico's $60M affordable-housing trust fund is the clearest existing example: 34 homes sold and 349 more approved as of early 2026, funded entirely by data-center tax uplift.[4] The net effect on housing is political, not automatic.
Water use depends on cooling design. Older evaporative-cooling campuses can consume tens of millions of gallons a year; newer waterless / liquid-immersion designs (Edged Columbus is a public example) are pushing that toward zero. Electricity is the bigger story: Irish data centers already used roughly 21% of the country's metered electricity in 2023, more than urban households,[7] and the U.S. AI buildout is driving analogous spikes in specific corridors, most visibly in Northern Virginia where Dominion load-growth forecasts have been revised upward several times.[11]
Yes, in two specific ways. First, per-rack power draw has jumped roughly 10× — from 4–10 kW per rack in traditional cloud workloads to 40–120 kW per rack for large-model training — which forces new cooling, new substation capacity, and a different construction timeline per megawatt.[11] Second, it compresses the timeline. Central Ohio went from essentially zero hyperscale in 2018 to three overlapping campuses announced by 2025. AI doesn't change the 30-to-1 construction-to-ops ratio, but it multiplies the number of times that ratio gets rerun.
Not much, yet, in the U.S. Ireland went the other direction — EirGrid and the CRU effectively paused new data-center grid connections in the Dublin region from 2022 onward, freezing greenfield applications until grid upgrades caught up.[7] Amsterdam layered siting restrictions on top of its own grid-capacity concerns.[8] U.S. counties have more varied moratoria and impact-fee experiments, but no national equivalent of a grid-operator pause yet. The political asymmetry favors approval: the tax revenue arrives within two to three years of first operation; the transmission-cost spillovers are absorbed by ratepayers across a whole utility territory and are much harder to attribute.
Not coders. Electricians, HVAC and controls technicians, substation crews, and transmission-line workers. BLS is already projecting sustained electrician openings, and at least a half-dozen state public-utility commissions have cited data-center load in their most recent integrated-resource-plan filings.[11] The real AI-era hiring question for host regions is whether the local workforce-development pipeline is sized to pour pads, commission chillers, run cable trays, build substations, and keep facilities online.
If there's a single take-away, it's that the headline jobs number is the wrong unit of analysis. A large U.S. hyperscale campus is a $1–2 billion construction project that produces roughly fifty permanent direct jobs, a specialized set of substation and critical-environment roles, and a stream of property-tax revenue whose real local effect depends entirely on what the county decides to do with it. Those three channels — construction booms, narrow specialist hiring, and fiscal recycling — are not interchangeable, and a county that judges a project by any one of them in isolation is going to get the math wrong.
The map that opened this article showed an industry concentrating in a tiny number of corridors. The reason, from Ashburn's 70% of internet traffic to Morrow's 250 MW along the Columbia River, is agglomeration: once fiber, power, and land coincide in one place, the economics of adding the next campus get easier every time. That's also why the common policy instinct — "the next cluster should land here, with my state's incentive package" — so often fails. The incentive package rarely changes the agglomeration; the agglomeration is the deal.
The useful question a county can ask is narrower and more honest. Not "how many jobs?", but what's the mix? Permanent direct operating jobs, construction job-years, indirect and induced work, wage levels, grid and utility employment, local tax effects, and housing / land impacts are eight separate things with eight different time horizons. Ireland has started to prefer projects by that mix; Virginia's oversight body is quietly measuring it; Amsterdam has added siting rules on top. Every U.S. locality serious about courting or constraining a campus is going to end up in the same place. The maps above are where to start: with the shape of the industry as it actually exists, and the labor evidence as it actually reads.