How Domino's, Sweetgreen, and independent restaurants draw profitable delivery zones. Drive-time math, industry benchmarks, and the mistakes that bleed margin.
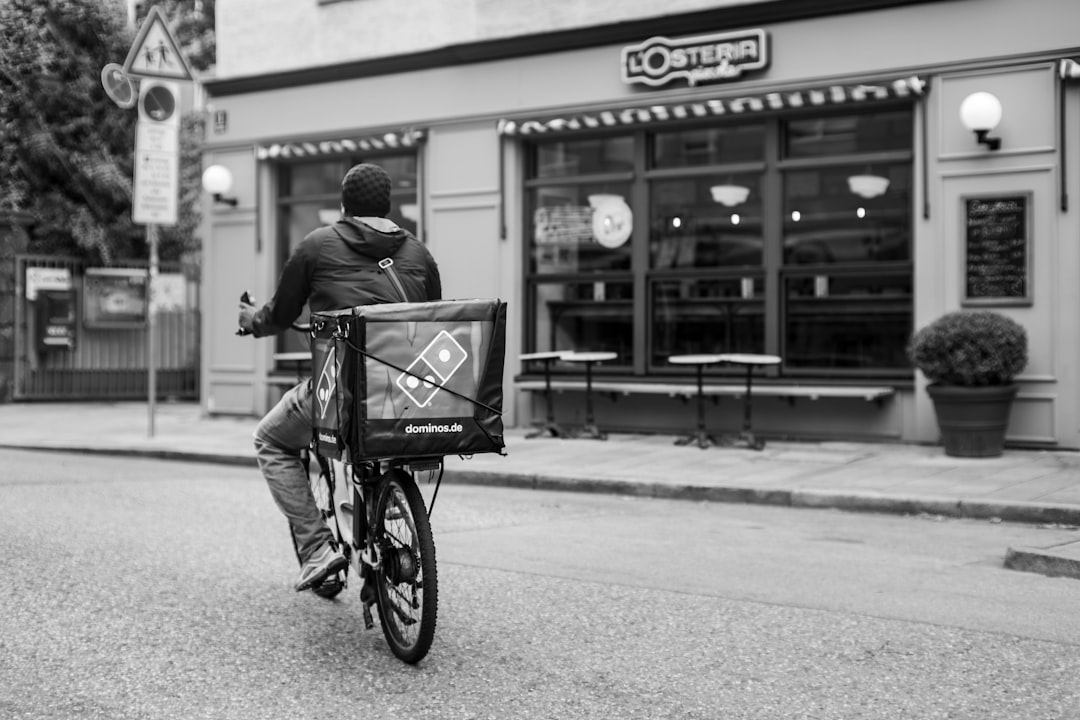
Domino's built an empire on a 30-minute delivery guarantee. In 1993, after a driver hit and killed a pedestrian rushing to beat the clock, they dropped it. What replaced the guarantee wasn't slower pizza, it was a different math problem. Domino's franchisees now draw their delivery zones around how far a driver can round-trip to keep a pie above 140°F, the temperature below which melted mozzarella stops being melted mozzarella. That's usually 5 to 7 minutes out from the store, no matter what the map says.
Most restaurants, grocers, and pharmacies still draw their delivery area the other way: a circle on Google Maps, measured in miles. It's wrong almost everywhere, and it's quietly costing money.
This guide walks through how to draw delivery zones that actually make money, the drive-time logic, the industry benchmarks that matter, and the mistakes that drain margin on every order. The framework applies to pizza shops, Instacart-style grocery fulfillment, pharmacy delivery, florists, and any business where a driver has to get a product to a customer on a clock.
Pick a hypothetical independent pizzeria in Chicago's Logan Square, just north of the I-90/94 interchange. A 5-mile radius on Google Maps covers parts of Lincoln Park, Bucktown, Humboldt Park, Wicker Park, and most of Avondale. It looks neat. It's also a fantasy.
The actual drive time from Logan Square changes wildly by direction:
A 5-mile circle misses half the story. It tells the driver "sure, deliver to West Loop, that's only 4 miles" and "sorry, Irving Park is too far, that's 6 miles", when one of those trips takes 22 minutes and the other takes 9. The circle includes the expensive deliveries and excludes the cheap ones. That's structurally backwards for margin.
A delivery area map drawn from actual drive times, what cartographers call an isochrone, doesn't lie to you. It bulges along the highway, contracts in dense traffic, and tells you the truth about where your drivers can actually get in, say, 12 minutes.
Highways. A single Kennedy Expressway ramp can double your reachable territory in one direction while doing nothing for the others. Cities built on grid-plus-highway hybrids (Los Angeles, Atlanta, Dallas) have the most distorted isochrones. Flat, gridded cities like Manhattan or Portland are closer to circular, but even there the river crossings and one-way streets bend the shape.
Traffic by time of day. A 20-minute drive at 10 AM is a 35-minute drive at 6:30 PM. If your pizza shop draws its zone at noon, it's promising customers something it cannot deliver at dinner rush, which is, inconveniently, when most orders come in.
One-way streets and bridges. Chicago has 26 major bridges across the river. Miss the right one and a neighbor two blocks away on the map is 15 minutes out by car. San Antonio, New Orleans, and Portland have similar bottlenecks.
Start with the actual cost number. The Bureau of Labor Statistics pegs the 2024 median delivery driver wage at around $16.70 an hour, with tipped restaurant drivers running slightly lower before tips. Add roughly $0.22 per mile for vehicle costs (fuel + maintenance + depreciation, the 2024 IRS business mileage rate is $0.67, but that includes overhead the restaurant isn't covering). Those are your two meaningful numbers.
Now run it for a delivery from our Logan Square pizza shop:
Zone 1 trip (0-10 minute round trip, ~2 miles) Driver cost at 10 minutes: $2.78. Vehicle cost: $0.44. Total: $3.22 per delivery.
Zone 3 trip (30-40 minute round trip, ~6 miles) Driver cost at 35 minutes: $9.74. Vehicle cost: $1.32. Total: $11.06 per delivery.
The outer-zone delivery costs three and a half times as much to fulfill. If both orders carry the same $3.99 delivery fee, the outer-zone order is losing $7 before the customer even pays for a slice. That's the whole problem, in three numbers.
Jimmy John's markets itself on "Freaky Fast" delivery, internally, they staff their stores to hit 15-minute total order-to-door on average, which caps their practical delivery zone at about 4 minutes of drive time in most markets. Their entire real estate strategy (storefronts every 1-2 miles in urban cores, anchored to college campuses) follows from that constraint.
Skip the 5-step outline. The real process is two loops: a sizing loop and a fine-tuning loop.
Generate drive-time polygons from your kitchen or warehouse at four thresholds: 10, 20, 30, and 40 minutes. You can do this with the driving radius map tool in about 90 seconds. Save or screenshot each polygon.
Now compute your break-even fee for each zone using real round-trip time (double the one-way isochrone threshold, a 10-minute isochrone is a 20-minute round trip). The break-even fee is the minimum price you need to charge, or the minimum average ticket you need to require, for the zone not to lose money.
Mark on the map:
For most independent pizza shops in mid-density American cities, that math draws a 15-to-20-minute outer boundary. Not 5 miles.
Here's where most operators stop. They draw zones, set fees, and never revisit. The best operators revisit monthly with one question: which zones are we underwater on?
Pull your delivery data and answer four things:
That last one is the counterintuitive winner. A 2023 analysis of Toast POS data across mid-sized independent restaurants found that customers in the outer delivery ring (past 22 minutes of drive time) had a 14% lower repeat-order rate than customers in the inner ring, even when the single-order satisfaction scores were similar. The long-range orders just don't come back. If your outer ring is losing money AND producing one-off customers, you're funding the delivery equivalent of a slow bleed.
A tiered structure prices each zone against its actual cost. Here's a pattern that works for the typical independent pizzeria in a mid-size metro:
Papa John's, Little Caesars, and Pizza Hut all effectively use this structure, though they hide it behind different words. The inner-zone "free delivery" at big chains is paid for by the $20 minimum order that magically appears in your cart when you type in an Irving Park address from their Logan Square store.
Same drive-time math, different constraints per category.
Food quality is the ceiling. Pizza holds above 140°F in an insulated bag for about 20 minutes; a plated pasta dish loses its appeal by 15; sushi shouldn't leave the kitchen if the trip is more than 12.
Domino's and Pizza Hut both build around roughly a 10-minute store-to-door target for 75% of orders, which translates to a 4-6 minute one-way drive-time zone. Independent Neapolitan pizzerias (where the pie is the whole product, not a vehicle for coupons) tend to restrict delivery to 15 minutes total or skip delivery entirely. Cleveland's Citizen Pie, for example, caps delivery at 3 miles, not as a policy but because the owner knows Neapolitan crust shatters the temperature test after 18 minutes.
Zones for most mid-market restaurants:
Different math. A grocery order takes 20-40 minutes to pick and pack, which means driver utilization is your real constraint, not drive time. A driver who spends 40 minutes picking can only do 1-2 deliveries per hour even if the drive is short.
Instacart solves this with crowd-sourced shoppers: the shopper picks, the driver delivers, and the workflow decouples. Amazon Fresh runs its own model with consolidated routes from micro-fulfillment centers, typically a 60-minute drive-time zone per hub because the cold chain on a refrigerated van tolerates it.
For an independent grocer, overlay your drive-time polygon with Census block-level population density. If a zone has fewer than about 500 households per square mile, you won't hit the order frequency needed to make a route profitable. Run the analysis as a full catchment area analysis before committing to a delivery launch.
The economics are the opposite of restaurant delivery. A prescription refill is lower-margin per unit but enormously higher in lifetime value, the same customer comes back every 30 days for years. Same-day is a nice-to-have; reliable delivery within the window is the product.
CVS's pharmacy delivery runs a 25-mile zone in most markets, not because drivers can cover it efficiently but because the lifetime value of a retained customer justifies the trip. Walgreens' tie-in with DoorDash effectively outsources the zone question, they just let DoorDash's platform economics decide where delivery works. Independent pharmacies competing with chains use 15-20 minute drive-time zones and batch by day (Monday = north, Tuesday = south) to get utilization back.
Two extras that don't apply to restaurants:
Holiday demand makes florists weird. 60% of annual revenue hits three days: Valentine's Day, Mother's Day, and the Christmas-through-New-Year window. The zone you can serve on a Tuesday in August is not the zone you can serve on February 14.
1-800-Flowers operates on a network-delivery model, your order gets routed to the florist in the destination area, sidestepping the zone problem. An independent florist without that network typically caps weekday delivery at 25 minutes of drive time, and on holiday peaks cuts that in half while pre-assigning drivers to pre-sold routes.
Product bulk matters too. Arrangements are heavy and awkward. A driver's van holds 15-20 arrangements at most, versus 40-50 pizzas. That cuts orders per route almost in half, which changes zone economics by about the same margin.
Most delivery failures happen before the checkout button, when a customer types an address and gets no signal that they're out of zone (or in one of the more expensive ones). The fix is embedding your zone on your site as a real, interactive thing, not a sentence.
Embed a delivery area map on your ordering page. A customer types their address, the map instantly shows whether they're inside a zone and what fee applies, and they don't reach cart-abandonment stage. RadiusMapper embeds handle this with a one-line iframe; most Shopify and Toast-based ordering systems support the same embed without plugin work.
Display your zone tiers as a small table above or below the map, fees, minimums, and a realistic delivery window per tier. Transparency reduces checkout friction more than any incentive. Customers almost never leave over a $3.99 fee. They leave over a $3.99 fee that shows up as a surprise at checkout.
You don't control the delivery zone directly on third-party platforms, but you set the maximum radius in each platform's merchant settings. Set that maximum at the break-even point after the platform's 15-30% commission. A 20-minute drive-time zone that works for your own delivery might be a 12-minute zone on DoorDash once the platform fee is out.
Many independent operators keep a tighter self-delivery zone and hand off farther addresses to DoorDash rather than turning them down entirely. You earn less per order, but the incremental revenue is real and the operational load is someone else's problem.
Whether you're on Toast, Square, Clover, or a custom Olo integration, delivery address validation should happen at checkout. The system geocodes the address, checks it against the polygon for each zone, and displays the right fee + window before the customer hits Place Order. Toast and Olo both support polygon-based zone definitions natively now; Square is catching up through its 2024 Delivery API updates.
Five numbers, not twenty.
| Metric | Why it matters | Healthy range |
|---|---|---|
| Drive-time accuracy | Promised vs. actual. If you quote 35 and it's 50, customers stop trusting you. | Within 5 minutes of promised on 90%+ of orders |
| Cost per delivery by zone | The profit-or-loss scoreboard. | Below delivery fee + minimum contribution margin |
| Repeat-order rate by zone | The canary for whether your outer zones are worth it. | Outer zone within 10% of inner zone |
| Zone rejection rate | How often customers abandon when they see the fee. | Below 12% in middle tier |
| Driver route density (stops per hour) | Driver utilization. Low density means you're running empty miles. | 2.5-4 for restaurants, 1-2 for grocery |
Some of these require integration with your POS; some require a spreadsheet. All five are within reach of an operator who gives it a disciplined Monday morning each month.
Don't redraw boundaries in response to one weekend. Run it like a two-week experiment.
Six weeks feels slow if you're used to next-day decisions. But one promotional weekend's spike will mislead the analysis, and you'll optimize for the wrong thing.
If you run more than 10 locations, or your order volume justifies the engineering time, zone management becomes an API problem rather than a map problem.
The developer API from RadiusMapper lets a backend service generate drive-time polygons on demand, check a given address against them, and return a zone assignment + fee + window in under 200ms. That's fast enough to run in the checkout flow.
You can use it for:
Your delivery zones need to feed your dispatch system. When a new order arrives, dispatch should automatically:
Onfleet, Bringg, and OptimoRoute all plug into polygon-based zone definitions. The integration is straightforward; the operational discipline is the hard part.
Traffic patterns shift. Chicago's Lake Shore Drive closes a lane for construction. A new Whole Foods opens and changes local traffic at dinner rush. Your polygon from January doesn't describe June. Revisit quarterly.
A 15-minute delivery is a 30-minute driver commitment. Every break-even calculation, every capacity model, every dispatch decision is round-trip. Operators who forget this over-promise capacity and under-price every outer-ring delivery.
A flat $4.99 fee for every zone charges the close customer too much and the far customer not enough. The close customer subsidizes the far one, which is both economically backwards and socially annoying, the close customer is subsidizing their neighbor's longer delivery.
DoorDash's Chicago delivery zones aren't a template for your Logan Square pizzeria. They're a function of DoorDash's driver network, not yours. Your zones should come from your kitchen location, your driver count, your average ticket, and your cost structure.
Show it upfront. The delivery area map belongs on the homepage or the order-start page, not buried in a post-cart disclosure. Surprise delivery-fee discovery at checkout is the leading cause of online-ordering cart abandonment in restaurants (roughly 29% of abandoned carts per Toast's 2023 benchmark report).
If you're building the site fresh, see our piece on service area maps for business coverage, same playbook, broader application.
There's no universal number, but the real ceiling is food quality, not distance. For hot pizza, 15-20 minutes of round-trip drive time is the practical cap. For grain bowls, sandwiches, or items that travel well in insulated bags, you can push to 25-30. Jimmy John's runs a 15-minute total-experience target and caps drive time at 4 minutes one-way to hit it. The ceiling is rarely about miles, it's about how long your product stays the product.
Size the zone based on drive time, not distance in miles. A 4-mile trip downtown might take 22 minutes; the same 4 miles on a suburban arterial is 9. Draw your zones with a driving radius map and you'll see the real shape.
Do the math per zone. If your average order contributes $8 of margin and the zone costs $3 to deliver, free works and it's great marketing. If the zone costs $11 to deliver, a fee or a minimum order is mandatory. Most independent restaurants run free delivery in Zone 1 as a customer-acquisition tool and charge tiered fees for outer zones, which is both profitable and intuitive to customers.
No. Third-party platforms charge 15-30% commission, which changes the break-even math. Your profitable zone for in-house delivery might extend to 22 minutes. Your profitable zone on DoorDash might cap at 12 after the platform fee. Calculate them separately, and feel free to serve customers inside the in-house zone with your own drivers while handing outer-ring orders to DoorDash at lower margin but zero operational load.
No, and it's not close. ZIP codes vary wildly in size. ZIP 10003 covers 0.7 square miles of Greenwich Village. ZIP 79734 covers 2,700 square miles of West Texas. Two addresses in the same ZIP code can be 4 minutes apart or 45 minutes apart depending on the ZIP. Drive-time polygons from the driving radius map are dramatically more accurate. For more on why ZIP boundaries are a poor proxy for travel, see our guide on distance between zip codes.
Yes, with API-level zone management. Using the developer API, you can regenerate polygons based on current traffic, driver availability, or demand. A typical implementation shrinks outer zones during peak hours (when every driver is precious) and expands during slow periods (when a driver with idle minutes is better used). Requires integration with your ordering system. Worth it at about 10+ locations or 500+ daily orders.
Quarterly at the operational level, monthly at the metric level. Re-run the polygons quarterly, or anytime a major road network change lands (construction, new arterial, major closure). Review the five metrics every month. Most operators who never revisit zones are funding operationally-underwater routes they don't know they're running.
 RadiusMapper