A browsable US electric substation map for siting data centers, solar farms, BESS, and crypto loads. Voltage class, estimated capacity, and the honest limits.
As of year-end 2024, about 2,300 GW of generation and storage capacity sat in US interconnection queues — more than twice total installed capacity in the country. Median time from interconnection request to commercial operation has more than doubled over the last fifteen years, and in CAISO it now averages 9.2 years. In PJM, average generator interconnection costs rose 728% — from $29/kW in 2018–2019 to $240/kW in 2020–2022 — driven almost entirely by network upgrade bills that got bigger every cluster. Projects that withdrew from PJM's queue during the same window paid a mean $599/kW before giving up.
Power is the new gating factor in every power-hungry site selection: data centers, AI campuses, crypto loads, utility-scale solar and storage, green hydrogen, DRI steel, aluminum. Speed-to-power, not land price, is what decides whether a project reaches commercial operation. And yet most site-selection teams, developers, and brokers cannot name the closest transmission substation to a parcel they are actively evaluating.
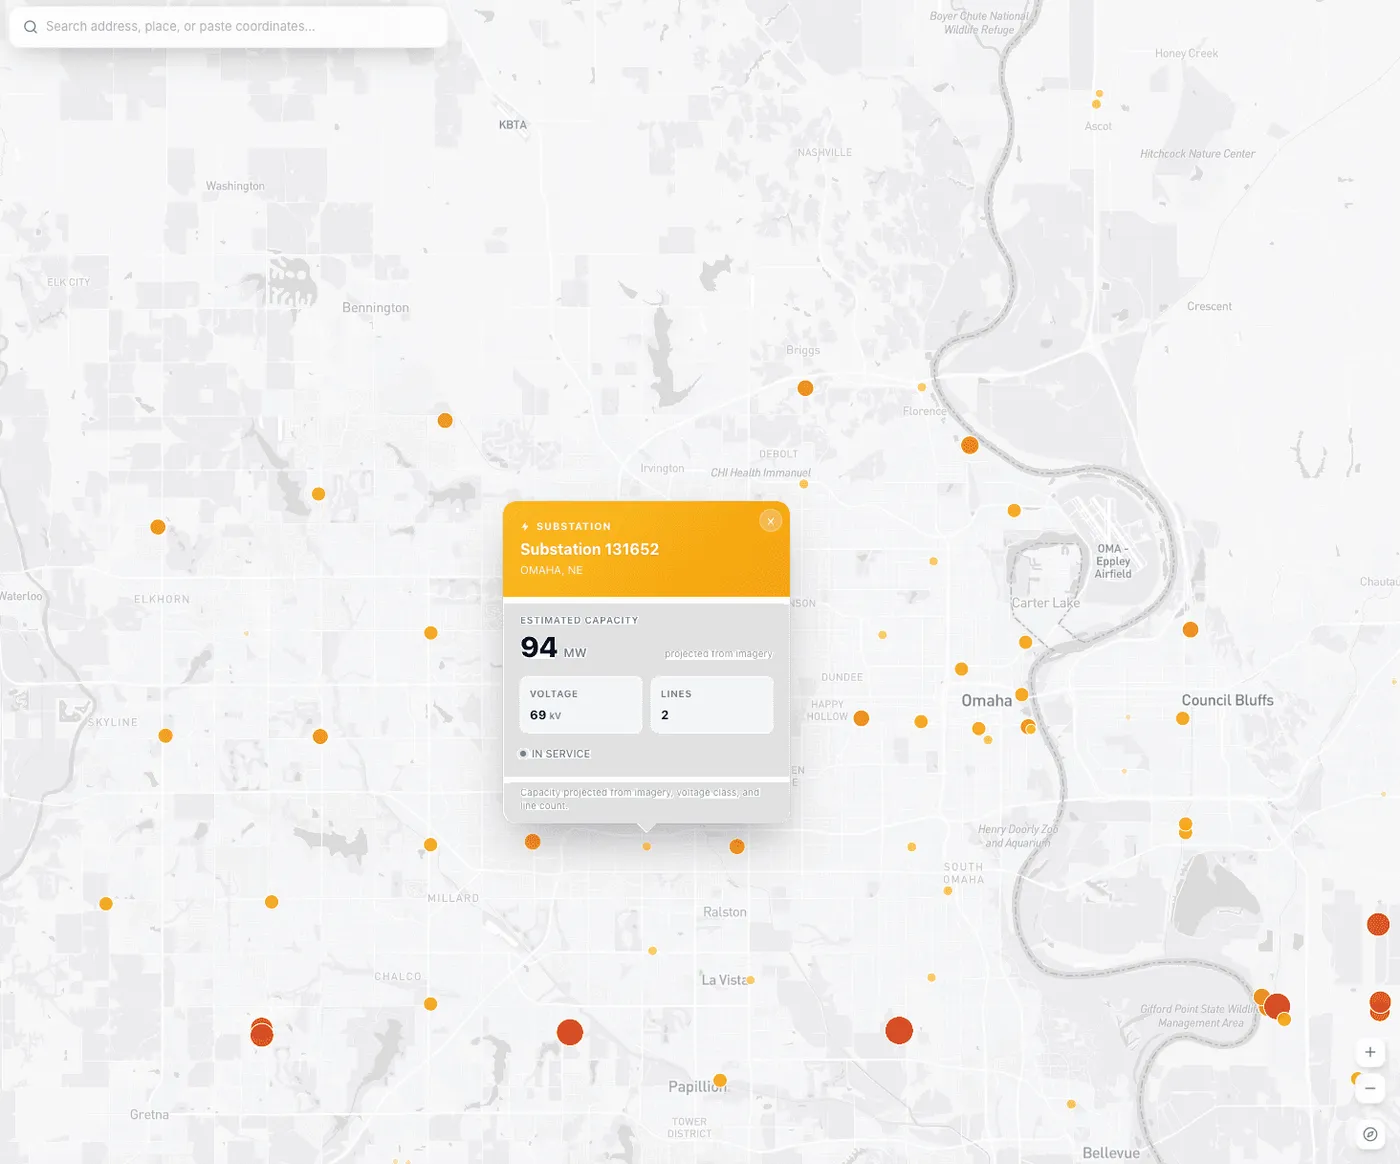
This map can. It plots every known US electric substation — about 80,000 of them — in your browser, colored and sized by estimated capacity and voltage class. Pan, zoom, click.
Sign up for free → · Open the substations layer
The rest of this guide is what the map is actually useful for, by audience — and where it stops being useful and you have to call the utility.
What a public substation map does well: it tells you in thirty seconds that a parcel is not worth a phone call. No 230 kV within ten miles of a proposed 100 MW data center campus? Walk away. No 69 kV+ bus within three miles of a 50 MW solar site? The gen-tie alone will kill the economics. No substation within a mile of a crypto hosting lease? You are paying for a new feeder build that the utility will quote in months, not weeks.
What it does not do — and any honest tool should say so — is tell you whether the substation it shows you has any spare capacity for your load. Available Transfer Capability, queue position at the bus, network upgrade assignments, tariff structures, dynamic stability margins: none of that is in public data. The map tells you which utility to call. The utility tells you whether the deal is possible.
That split is the whole point. Most site-selection work runs sequentially — screen with public data, then burn real money on utility conversations, cluster studies, and consultant engagements. The map is the screen. The rest of this guide is how to use it for the audience that describes your load.
Four voltage tiers matter for site selection, and they slot cleanly to load size.
Number of transmission lines at a substation matters too. One feeder is single-contingency risk; the utility will not let a 100 MW data center hang off of it without a second feed. Two or more lines terminating at a substation is the minimum for any serious N-1 planning. The map shows both voltage class and line count; the judgment call is yours.
Hyperscale and AI site selection has collapsed to a power-availability screen run before anyone talks about real estate. A site selector at Meta, AWS, Microsoft, or Google works with a broker (JLL, CBRE, Cushman) and the utility's large-load relationship team to identify a substation or switchyard that can deliver 100–500 MW within 24 to 36 months. They sign a Large Load Letter of Agreement, run a Facilities Study that takes 6–18 months, negotiate a Contribution In Aid of Construction that in Dominion's territory now runs past $1.5M/MW, acquire land inside a five-mile radius of the target substation, and only then begin detailed design. Ground-breaking to energization for anything above 250 MW is routinely three to five years.
The obvious shortcut is to skip the grid. Microsoft's 2024 deal to restart Three Mile Island Unit 1 reserves 835 MW for twenty years. Meta ran a 2024 RFP for 1–4 GW of new nuclear capacity. Amazon paid Talen Energy for a co-located 960 MW AWS campus at Susquehanna Nuclear — a deal FERC rejected in November 2024, forcing a front-of-meter restructure that Amazon now has to negotiate through PJM's standard queue. When regulators push back on behind-the-meter shortcuts, you end up in the queue like everyone else.
Queue reality by RTO matters if your site is not adjacent to a nuclear plant. Approximate project-to-operation times for generators completed 2022–2024: CAISO 9.2 years, PJM transitioning toward cluster studies under Order 2023, MISO deep in DPP backlog, ERCOT the fastest major market at about 4.5 years, ISO-NE at 3.8 years. PJM is effectively closed to fast-track large loads in Virginia and eastern Ohio; Dominion currently has roughly 70 GW of new demand in its queue, about 25 GW of it assigned to interconnections projected between now and 2031. Phoenix's APS and SRP footprints are similarly saturated with AI campus requests.
Where there is real headroom: west Texas and the Permian (ERCOT), upper MISO (Minnesota, the Dakotas), SPP's Oklahoma/Kansas wind belt, parts of MISO South, and pockets of the Southeast. A substation map filtered to 230 kV+ over those regions, cross-referenced with the RTO's public queue report, produces a real shortlist in a couple of hours.
For colocation at 5–50 MW the criteria shift. Fiber comes first — most colo operators want to be within five miles of a major dark-fiber corridor and inside 150 miles of a top-tier interconnection hub. Power is second, typically off a 69 kV or 115 kV distribution substation. Dual-feed from two separate substations is the Tier III/IV requirement, and the map can flag parcels that have two candidates within reasonable distance before the utility walks the site.
One thing the map won't tell you but that decides many deals: AEP Ohio's recently adopted large-load tariff can add about $10 million in first-year costs to a 100 MW data center. At least 36 utilities have now adopted some form of large-load tariff, with structures ranging from standby demand charges to minimum-take provisions to mandatory economic-development contracts. The map gets you to the utility. The utility's regulatory filings tell you whether the tariff kills the deal.
A utility-scale solar developer's first screen, after the resource overlay, is proximity to a 69–230 kV substation with queue headroom. Gen-tie transmission lines run approximately $1 million per mile, and a 10-mile gen-tie adds about $10M to a 100 MW project — survivable, usually. A 30-mile gen-tie adds roughly $30M and is fatal unless the PPA is premium. SunZia's 130-mile, 345 kV gen-tie is the rare exception, viable only at three-gigawatt-plus scale with federal transmission incentives. The rule of thumb: anything more than five miles to the nearest acceptable point of interconnection is economically dead for mid-size solar.
The queue is where solar projects go to die. MISO's DPP 2022 Phase 1 South study generated roughly $7.2 billion in network upgrade assignments across its cluster, triggering withdrawal of about 63 GW across 378 projects, many of them solar. Lawrence Berkeley's PJM analysis shows a clear split: surviving projects paid a mean $240/kW in interconnection costs; withdrawn projects paid $599/kW before giving up. The map cannot show you which substations produce which outcome. You have to post the deposit and wait for the cluster study.
Interconnection cost by technology cohort, from the same analysis: natural gas $24/kW, onshore wind $136/kW, solar $253/kW, energy storage $335/kW, offshore wind $385/kW. Storage is currently the most expensive thing to plug in per kilowatt, which is one reason co-located solar-plus-storage pencils better than standalone BESS in most interconnection clusters.
BESS site selection collapses a couple of simple rules. Standalone storage projects want to be within 500 to 1,000 meters of a suitable 33 kV or 138 kV+ bus — the sweet spot is tight because step-up transformers and short runs of collector cable dominate the cost. Co-located solar-plus-storage uses the solar project's existing POI and changes the math entirely. The map tells you which parcels are even in the conversation.
What the map cannot tell a storage developer: nodal price spreads, which are where the business case lives. An otherwise-identical BESS asset can be a money printer next to a peaker in a congested node and worthless on the other side of a flowgate a mile away. Yes Energy, Enverus Trading Analytics, and Aurora Energy Research sell the data that actually determines whether the site is worth building. The map gets you the physical candidates; the nodal service picks the winners.
Crypto mining is the one audience where a public substation map comes closest to being a complete first-pass tool. Miners are the most location-flexible power buyer in the market — they care about one number, $/kWh, and they will sign interruptible tariffs and curtailment agreements that most industrials refuse. All-in targets are typically under $0.045/kWh. Site-to-hashing is routinely six to twelve months, the fastest load in this guide.
Three siting patterns dominate. Stranded flare gas at Permian, Bakken, and Eagle Ford wellheads — pair a public substation map with VIIRS satellite flaring data and you can cold-call landowners within a mile of rural 138 kV buses. Curtailed wind and solar, especially ERCOT West Zone and parts of SPP's wind belt — look for substations where generation routinely exceeds local transmission capacity and prices go negative during windy hours. Bankrupt or underutilized industrial sites with existing heavy service — old paper mills, aluminum smelters, steel plants. An abandoned 34.5 kV industrial interconnect is gold, and it's often adjacent to a substation that still has headroom because the former tenant left a decade ago.
The economics on interruptibility are staggering. In August 2023 alone, Riot Platforms earned $31.7 million from ERCOT curtailment and demand-response credits at its Rockdale, TX facility — more than it earned from actually mining bitcoin that month. This is not a gimmick; Marathon's CEO Fred Thiel puts curtailment frequency at "less than 3% of the time, about five to ten hours a month" in deal terms that pay miners to turn off. The right controllable-load services agreement at the right ERCOT bus can be worth more than the mining revenue it interrupts.
Texas is now a mixed story. SB 6, effective December 31, 2025, requires any load ≥75 MW in ERCOT to be able to curtail or switch to on-site generation during grid emergencies. ERCOT's large-load queue went from 63 GW to 226 GW in a single year — more than 70% of it data centers — and the consequence is that new crypto sites will be vetted for curtailability from day one. Rural Kentucky, Tennessee, and upstate New York cooperatives have increasingly adopted moratoria on new crypto loads, so the map alone is not enough; you also need to check whether the local co-op is open for business.
For crypto the workflow is tight: filter the map to 69–138 kV in your target region, cross-reference with flaring or curtailment data, find owners within a mile of the right dots, run the interruptibility math against the tariff, call the utility. Of all the audiences in this guide, crypto is the one where starting with a map saves the most time.
Heavy industrial site selection is a five-to-ten-year exercise dominated by the price of power, not the availability. A green ammonia plant, a DRI steel mini-mill, an aluminum smelter, or a refinery-adjacent hydrogen facility all need sub-$40/MWh firm power — the hard ceiling for aluminum smelting economics — plus port access, feedstock, and CO2 sequestration geology. Substations matter after the power contract is structured, not before.
The map's role for industrial is narrow but useful: eliminate regions without two independent 345 kV+ feeds. Any load above about 500 MW that needs true N-1 reliability will not be served by a single feed, and a lot of flyover country that looks good on a demographic map disqualifies itself on this one filter. Pinnacle Resource Consulting and Tractus Group both report using public substation data early to shorten candidate-county lists from fifty to twelve before any utility conversation.
The actual deal is negotiated, not sited. Every successful aluminum, DRI, or hydrogen siting in the last decade was won on a bespoke utility contract with 10–20 year fixed-price components, often brokered with state economic development authorities over the objections of residential ratepayer advocates. Emirates Global Aluminum announced Tulsa Port of Inola in 2025 as its US smelter site after evaluating more than 100 locations; public disclosures noted proximity to multiple 345 kV substations with redundant sourcing as a hard requirement. The MidAmerican, AEP, and GRDA transmission overlay in eastern Oklahoma satisfied it. The map showed which counties had the infrastructure. The signed wheeling arrangement across three utilities is what made the deal possible.
Once the map gives you two or three substations worth investigating, the next screen is the RTO's public queue. A substation with ten projects already queued at the bus is a different story from one with none. The queue is a market — positions are filed, withdrawn, reassigned constantly, and current RTO data indicates well over 70% of interconnection applications are eventually withdrawn before reaching commercial operation.
Useful reference points by RTO (current reporting):
FERC Order 2023 and Order 2023-A (compliance May 2024) mandate cluster-based, first-ready-first-served processes across all RTOs with financial penalties on late studies. Implementation is uneven as of late 2025. The DOE and FERC have a joint April 30, 2026 deadline for further "speed-to-power" rulemaking. If you are siting a large load today, knowing which reform cycle the target RTO is in matters as much as knowing the voltage class of the nearest substation.
The honest constraints on any public substation map — ours or anyone else's:
Five calls to make after the map has done its job:
The substations layer sits inside the Data Marketplace in RadiusMapper's app workspace. Toggle it on, pan to your target region, zoom in, click any dot to see the substation's name, voltage class, line count, status, and estimated capacity. Filter by voltage class to isolate transmission-grade facilities. Cross-reference with demographics for workforce screening (Location Intelligence), travel-time isochrones for commute and logistics, trade-area analysis, and 3D terrain from aerial LiDAR for buildable area — all in the same map.
Bring your own candidate parcels, screen them in an afternoon, and short-list the ones that deserve a utility phone call.
Start for free → · Open the substations layer
How close does a data center need to be to a substation?
For loads of 10 MW or more, typically one to three miles from a suitable sub-transmission or transmission substation. Hyperscale campuses (100+ MW) usually locate within five miles of a 230 kV or 345 kV substation and build a dedicated customer substation on the parcel fed from the nearest high-voltage line. For small enterprise data centers under 5 MW, standard utility service within a mile of any distribution-class substation is typically sufficient.
How close should a BESS project be to a substation?
Most standalone battery energy storage projects site within 500 to 1,000 meters of a viable 33 kV or 138 kV+ substation. Short collector runs and step-up transformer costs make longer distances uneconomic unless the project is co-located with solar and shares the solar POI.
How long is the interconnection queue in the major US markets?
Median project-to-operation times, generators completing 2022–2024: CAISO about 9.2 years, ERCOT about 4.5 years, ISO-NE about 3.8 years, PJM and MISO currently transitioning under FERC Order 2023 to cluster processes with multi-year waits. Queue-to-commercial-operation for new large loads in the major RTOs is running 24–48 months under the fastest paths, longer in constrained regions.
What voltage class do I need for a 100 MW data center?
Typically 230 kV transmission or higher, stepped down through a customer-owned 230/34.5 kV substation on the parcel. Service at sub-transmission (69–138 kV) can support 100 MW in some utilities, but redundancy and tariff economics usually push hyperscale customers to transmission-class service.
What is a point of interconnection?
The electrical point at which a generator or load connects to the utility's transmission or distribution system — typically a substation bus, a line tap, or an intermediate switchyard. POI location, voltage class, and available capacity are the three variables that drive interconnection study outcomes and cost.
Where is the cheapest power for bitcoin mining in the US?
Historically west Texas and the ERCOT West Zone (stranded wind, curtailment credits), the Permian and Bakken (flare gas capture), upstate New York and the Pacific Northwest (hydro), parts of Wyoming and Kentucky (coal-tied rates), and rural cooperatives in the Southeast. Site selection has narrowed since mid-2024 as large-load tariffs and curtailment requirements have matured.
How do I find available substation capacity?
There is no single public source. The fastest path is: use a public substation map to identify candidate substations by voltage class and proximity, then request an informal capacity indication from the utility's large-load interconnection team. For formal numbers, post the required deposit and enter the RTO's interconnection study cluster.