 RadiusMapper
Data layers
Every kind of data, on the map you're already using
Property, people, movement and infrastructure data in one catalog, from a US power grid map to Opportunity Zones and census tracts
Property records, demographics, foot traffic, the power grid and the public layers agencies publish, in one catalog. Switch a layer on, or search for the one you need.
Overview
One catalog for the data a site decision needs
Vetting a site usually means a stack of tabs: one for demographics, one for the utility's map, one for zoning and another to find out who owns the parcel next door.
Here it's one catalog on one map. Property records cover owners, sales and loans on every parcel. Demographics color every tract by income, age, rent and commute. Visitor data shows who comes to a place, when, and from where. Infrastructure layers map transmission lines, substations and power plants, and schools and Opportunity Zones are a switch away.
For anything more specific, like zoning, flood zones, utilities, permits or aerial imagery, search for it. Layers published for the area on your screen come back ranked, and draw on your map in their own colors. Your own files sit in the same library.
Demographics by tract
Neighborhood Numbers Instead of County Averages
County averages hide the block you care about. Census layers color every tract by median income, age, rent, poverty, commute and more, and one click gives you the exact value and FIPS code. Put rent over vacancy and you can see which tracts could carry new units.
- 18 tract-level metrics, from income to internet access
- A legend on the map and the tract's value on click
- Updates to the newest release on its own
The grid
Know Where the Power Is Before Calling the Utility
Transmission lines are colored by voltage, substations carry an estimated capacity in megawatts, and power plants are sized by output. Click a line and you get its owner and the two substations it connects. For a data center, battery storage or another large load, that's enough to build a shortlist before you call the utility.
- Substations with estimated MW, kV and connected lines
- Lines colored by voltage class, heavier at 330 kV and up
- Power plants by fuel, from solar to nuclear
Public layer search
Whatever Your County Publishes, One Search Away
Type zoning, flood, sewer or aerial and you get the layers counties, cities, states and agencies publish for the area on your screen, with the ones that cover your view on top. Peek at the fields and a few real rows before you add anything. It lands in the publisher's own colors, small layers save to your library, and big ones stream in live as you pan.
- Data, map and imagery services, ranked for your view
- Each result shows its reach and the year it was updated
- Dead, locked and empty layers dropped before you click
Capabilities
What You Can Switch On or Pull In
Demographics by tract
Eighteen tract-level metrics color every tract in view, with a legend and the tract's value and FIPS code on click.
Substations with estimated capacity
Each substation shows a modeled capacity in MW alongside its voltage, connected line count and operating status.
Transmission lines and power plants
Lines are colored by voltage class with owner and route on click, and plants are colored by fuel and sized by capacity.
Schools and Opportunity Zones
Public and private schools are pinned with their address, and designated Opportunity Zone tracts are shaded.
Search public GIS data
Type a topic and get layers published by counties, cities, states and agencies for the area on screen, with fields and sample rows to check first.
Maps and imagery, not just data
Published map and imagery services are drawn by the publisher's own server, so they come through complete at every zoom.
The publisher's colors
Layers keep the symbology their publisher gave them, so a county zoning map still reads like a zoning map.
Live or stored
Small layers download to your library and keep working if the publisher's server goes down, and big ones stay live and load what's in view.
Use Cases
How Site Teams Put the Layers to Work
Screening land near high voltage power lines for battery storage
You need parcels close to transmission and a substation big enough to interconnect. Driving the region to find them takes weeks before the first utility conversation.
Result: A shortlist of parcels next to substations, each with voltage and estimated capacity to bring to the utility.
Using an opportunity zone map to source multifamily deals
Your fund is hunting for rental sites inside designated tracts where rents can carry new construction. You want to rule tracts in or out before paying for broker tours.
Result: A short list of designated tracts, each with rent, vacancy and tenure figures tied to its FIPS code.
Siting a childcare center where young families live
You're choosing between three neighborhoods for the next center. It comes down to where young families live and what they can afford.
Result: One neighborhood you can defend with tract-level child population and income, plus a drive zone that sizes it.
Pulling county zoning and flood GIS data into a site review
You're reviewing a rezoning request and need the county's zoning and flood layers on top of parcel lines. Downloading and converting files from each portal eats half a day.
Result: Zoning and flood on the same map as the parcels, without downloading or converting a single file.
Reference
What's in the data catalog
Property records
- Parcel lines across the US
- Owner name and mailing address
- Sales, loans and notices in date order
- Assessed value, acres and land use
- Absentee, equity and distress flags
- The owner's other properties
People and income
- Population
- Median household income
- Median age
- Under 18 population
- Senior population (65+)
- Diversity index
- Per capita income
- Poverty rate
- Employment rate
- Bachelor's degree or higher
Housing and access
- Median home value
- Median rent
- Owner vs renter
- Vacancy rate
- Average household size
- Average commute time
- Zero-vehicle households
- Internet access
Movement and audiences
- Visits by hour and day
- Visitor home ZIP codes
- Share of visitors who return
- Where visitors go next
- Audience personas and spending
Energy grid
- Substations: estimated capacity in MW
- Substations: voltage, connected lines, status
- Transmission lines colored by voltage class
- Lines: owner, route, type, status
- Power plants by fuel, sized by capacity
- Plants: technology, utility, location
Sites and base data
- Public and private schools
- School address, county and locale type
- Opportunity Zone tracts, shaded
- Parcel lines across the US
- LiDAR wherever public surveys have flown
Public layers you can search
- County and city zoning
- Flood and hazard layers
- Utility and infrastructure layers
- Permits, planning and land use
- Parks, schools and public facilities
- Aerial imagery and published maps
- Statewide and national datasets
How layer search works
- Keyword search ranked for your view
- Data, map and imagery services
- Covers this view, or statewide, county and city tags
- Year each layer was last updated
- Peek at fields and sample rows
- Publisher's own colors kept
- Small layers saved to your library
- Big layers stream live as you pan
- Open the source on the publisher's site
Works With
Connected to the Rest of Your Map
Drive-time maps
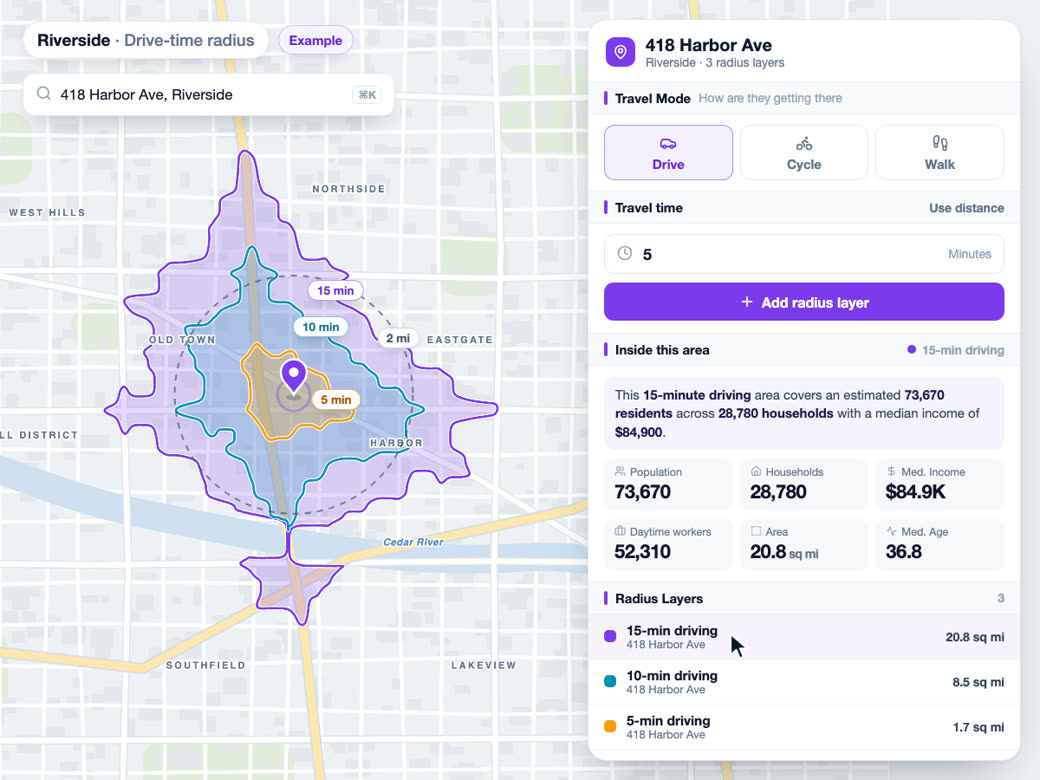
Drive-time zones total the same census tracts these layers map, so a layer shows how values vary inside a zone you have drawn.
Learn more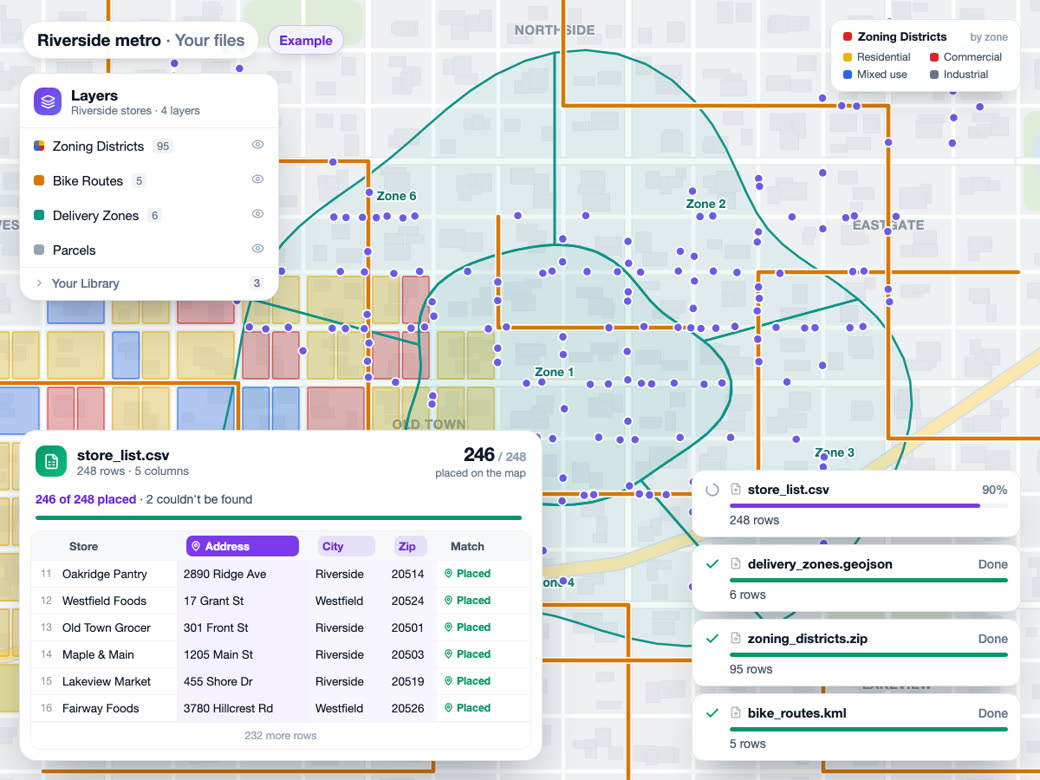
Bring your own data
A public GIS layer you download lands in your import library like any uploaded file, with the same data sheet, filters and styling.
Learn more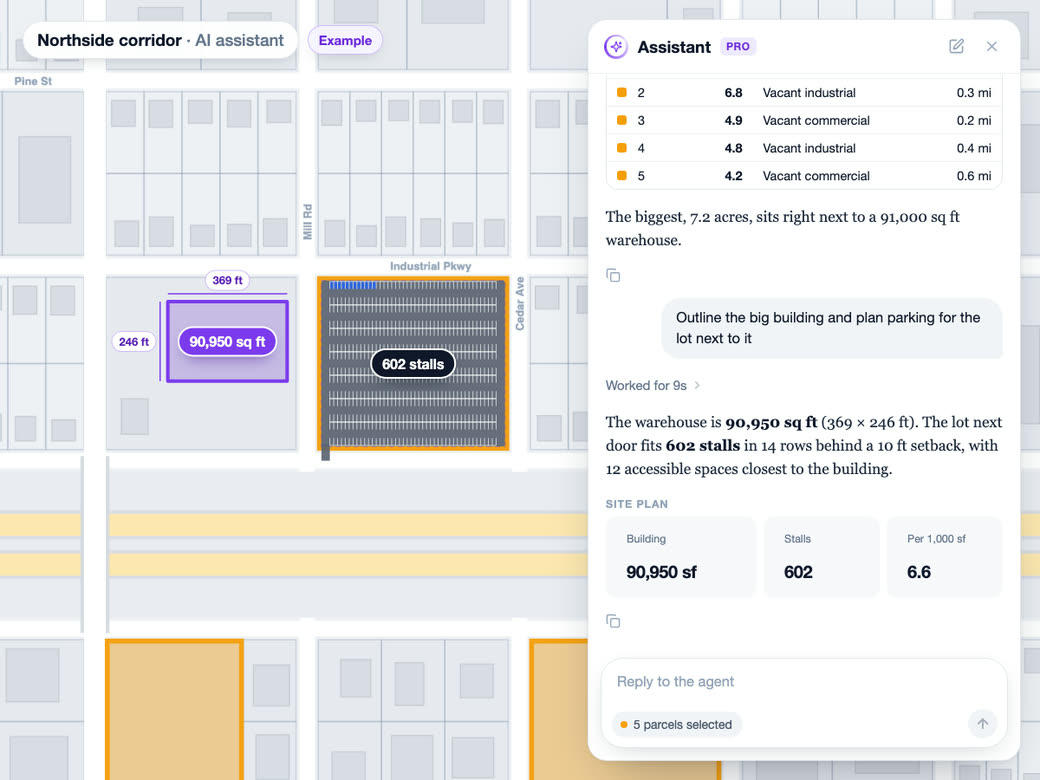
AI analyst
The AI analyst can query substations, power lines, power plants, schools and Opportunity Zones directly, and it can search public GIS catalogs and pull in just the area you're asking about.
Learn moreSolutions
Where Teams Use It
Trade Area AnalysisLearn more
Customer catchment and market penetration.
Location IntelligenceLearn more
Foot traffic, demographics and market insight.
Data LibraryLearn more
Demographic and census data layers.
Try Data layers on Your Own Site
Free to start. No credit card required.
Common Questions
What census data can I map by tract?
Eighteen measures, and each one shades every tract in view. On the people side that's population, income, age, poverty, education and employment. On the housing side it's home value, rent, vacancy, owner vs renter, commute, car ownership and internet access. Click any tract for its value and FIPS code.
Where can I find a map of electrical substations?
Turn on Electric Substations in Data. They cluster when you're zoomed out and split apart as you zoom in, and clicking one shows estimated capacity, voltage, connected lines and status. Add Transmission Lines and Power Plants and you have the local grid in one view.
How is substation capacity estimated?
It's modeled from the substation's voltage class and how many lines connect to it. It isn't a rating from the utility, and it doesn't tell you what's open for interconnection. Use it to narrow the list, then confirm with the utility.
How do I find Opportunity Zones on a map?
Turn on Opportunity Zones in Data and every designated tract in view is shaded. Put Median Rent or Poverty Rate on top to compare them, click any tract for its FIPS code, then click into the parcels inside the zone to see who owns them.
How current is census tract data?
Demographic layers use the latest published estimates and switch over when a new release comes out. Five-year numbers are averages over that window, which is what makes them steady enough to trust at the tract level.
Can I add county GIS layers like zoning or flood zones?
Usually, yes. Search layers looks through what counties, cities, states and agencies publish for the area on your screen, and the results that cover your view come first, tagged with their reach and the year they were last updated. Peek at the fields, then add it. Small layers save to your library, and big ones stream live as you move the map.